Insights & Alerting for your Azure Data Factory
The idea for this simple but efficient service was born while investigating failing ADF jobs that kept running nonstop for days without anybody noticing them. Avoid wasting your precious time (and money) because of unexpected errors or long running jobs by employing our solution. Just this one simple step - to get one step ahead.
How are we doing?
The cockpit dashboard gives you the high level management information and answers the most important questions at a quick glance. With the FullData ADF Insights monitoring & alerting service, you will receive an Email alert when the duration thresholds are exceeded. This gives you the ability to track + visualize duration of all your pipeline executions and get notified when the business is not normal.


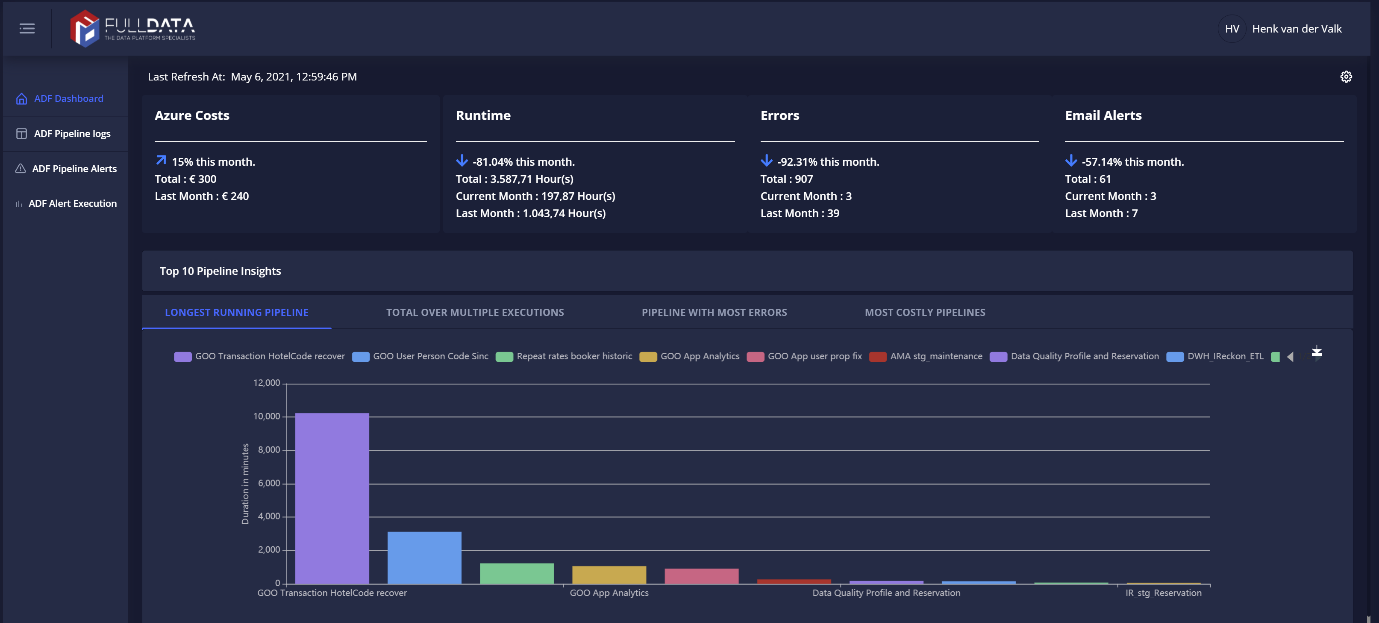
Azure ADF Dashboard
The overall and easy to interpret health kpi’s compare some relevant Month over Month performance metrics:
Azure Cost
Month of Month cost insights per resource with history and trends, without sliding windows.
Which resources are most costly? The graphs will show you the % increase or decline.
Runtime
A must have overview is insights in the overall time spend on Pipeline executions and durations.
Month over Month comparisons will highlight the growth and/or decline ratios.
Errors
Pipeline executions that result in errors are a waste of time and resources. Strive to operational excellence by minimizing errors. The FullData dashboard provide insights in the relative number of errors reported Month over Month. This indicates the overall quality of operations of your ADF implementation.
Email Alerts
An email to alert you when things are running out of control bring peace of mind. The number of emails send out to the support teams are also a good indication on overall health and a great instrument to steer towards stability and better predictable operations.
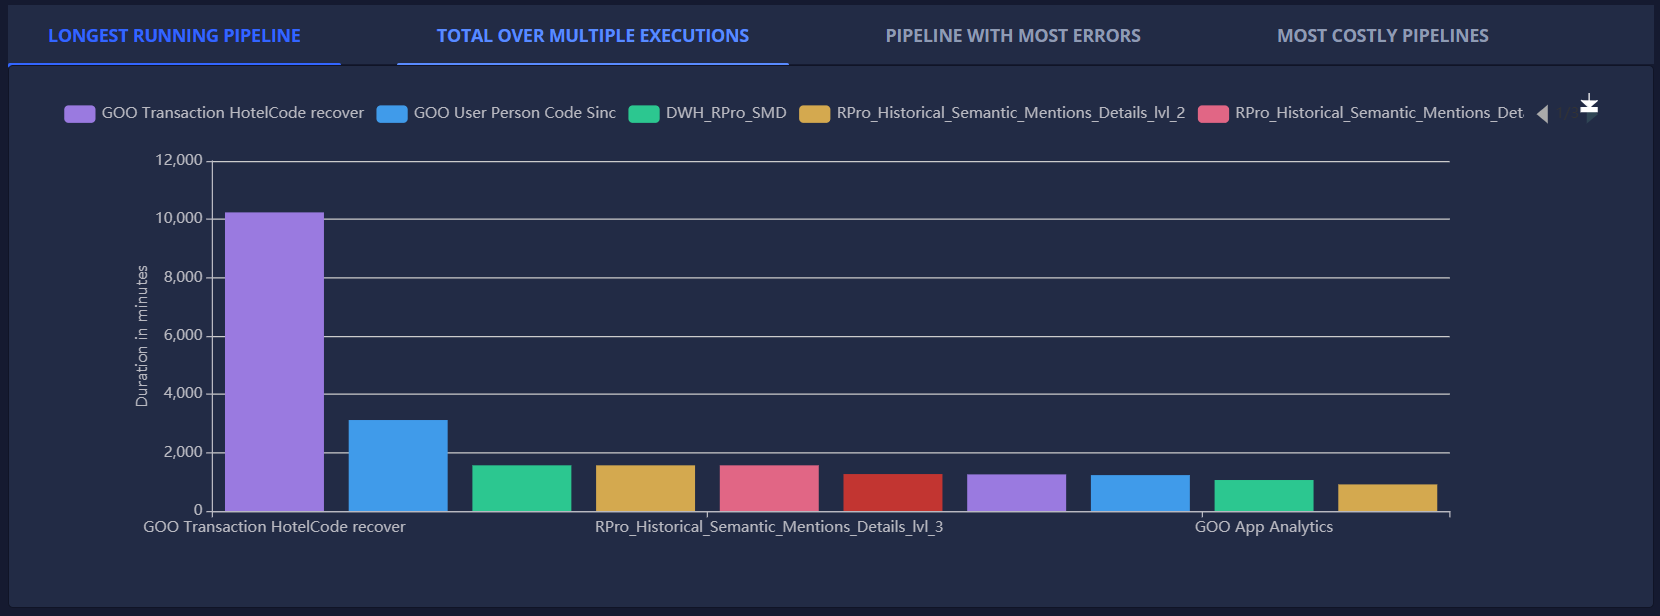
Quick Insights
Understanding which pipelines actually report the highest durations is key to make proper decisions.
These are all available from the main dashboard:
- Top 10 long running single pipeline executions
- Top 10 highest duration per pipeline overall (the number of Executions x frequency)
- Top 10 pipelines that generated most errors
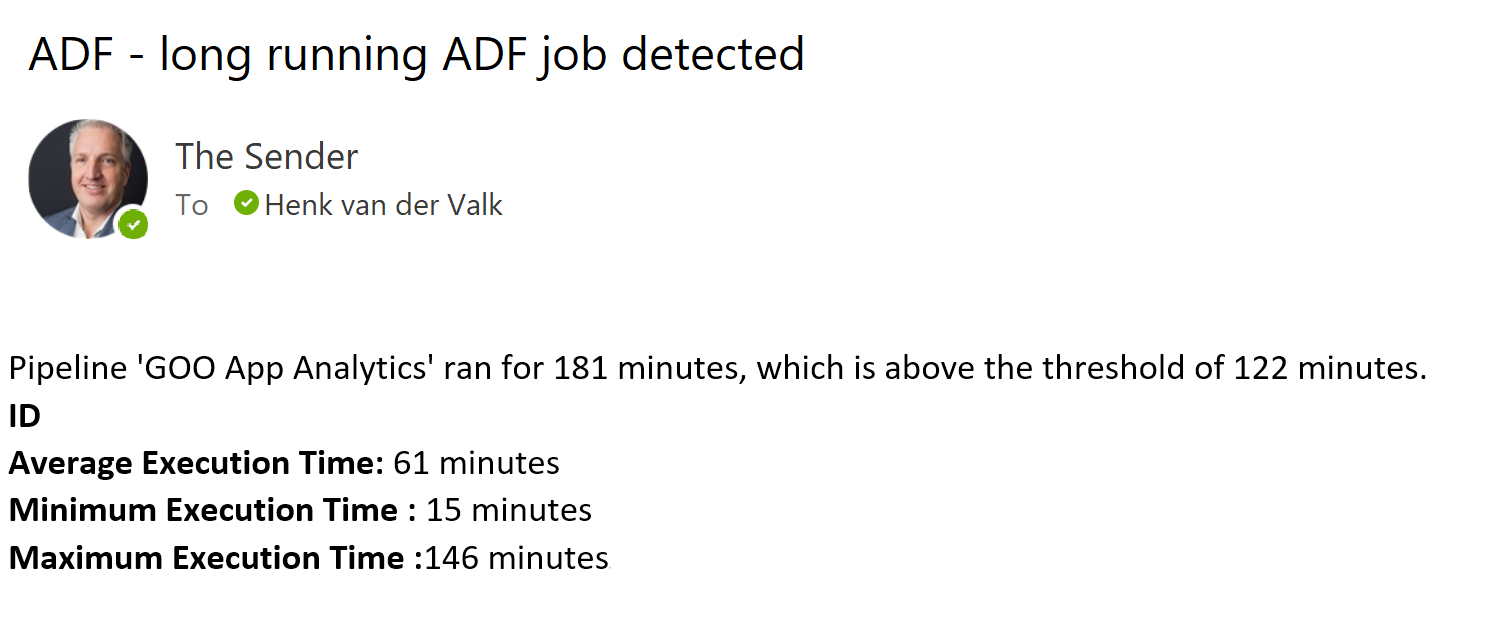
Proactive alerts
Receive Email alerts when pipeline duration exceeds a generic- or specific threshold.
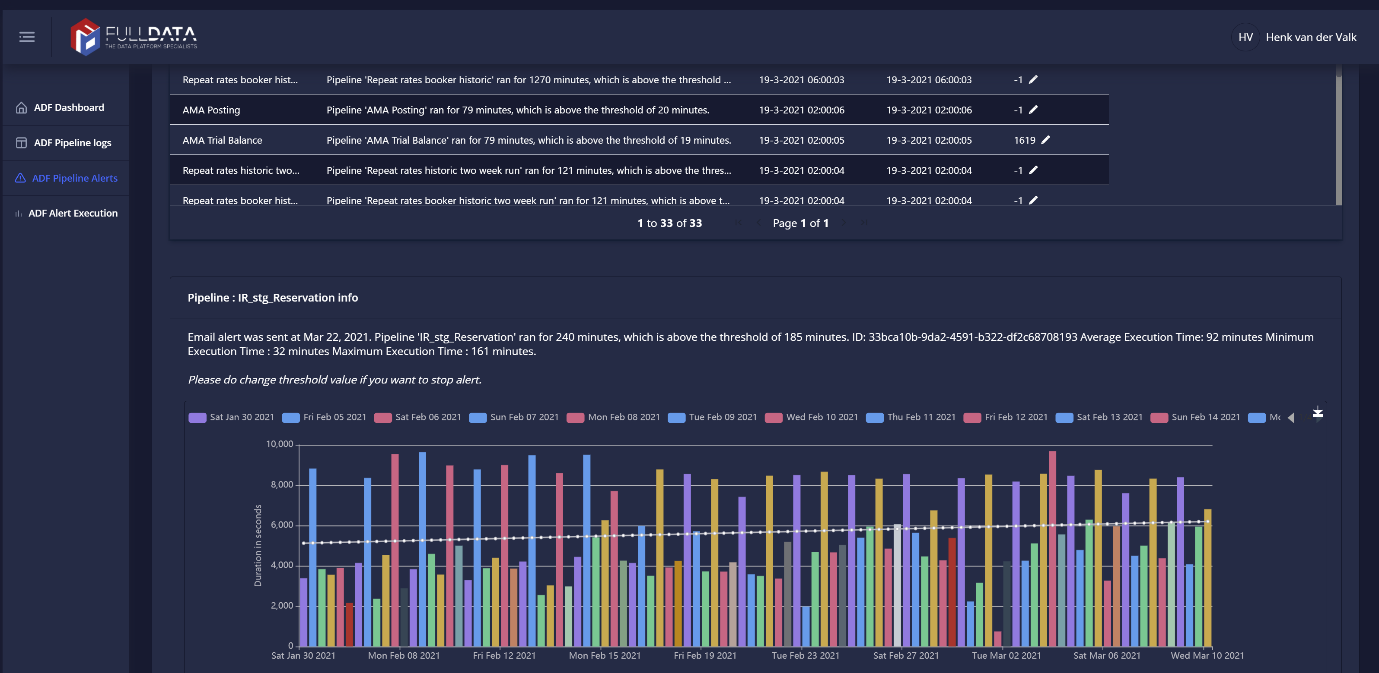
Trends over time:
Pipelines tend to process more and more data over time. The full history of execution durations is tracked for trend analysis:
With the FullData ADF monitoring solution it is easy to get grip on your Azure Data Factory environment. Detect failing pipelines, improve overall quality and run your ETL cost efficient.
The latest version of the ADF insights & alerting application retrieves its data direct from the API’s, no need to enable Azure log analytics and receive less false positives on runtime alerts.